
U.S. Real Estate Investment – Value-Generating Factors
At Ativore, we combine cutting-edge technology and years of experience to help international investors generate income in dollars and build wealth through a diversified portfolio of institutional-quality private real estate assets in the U.S., via direct investment, co-investment in properties, senior debt and mezzanine. This innovative approach was presented in this article here.
This is the first in a series of articles that will guide the reader through the Investment Selection process developed by Ativore. In this article, we describe the Value Drivers Model, which aims to break down the Internal Rate of Return (IRR) of an operational real estate investment (in operation and generating income for the investor) into five factors, indicating their respective contributions to the investment's return.
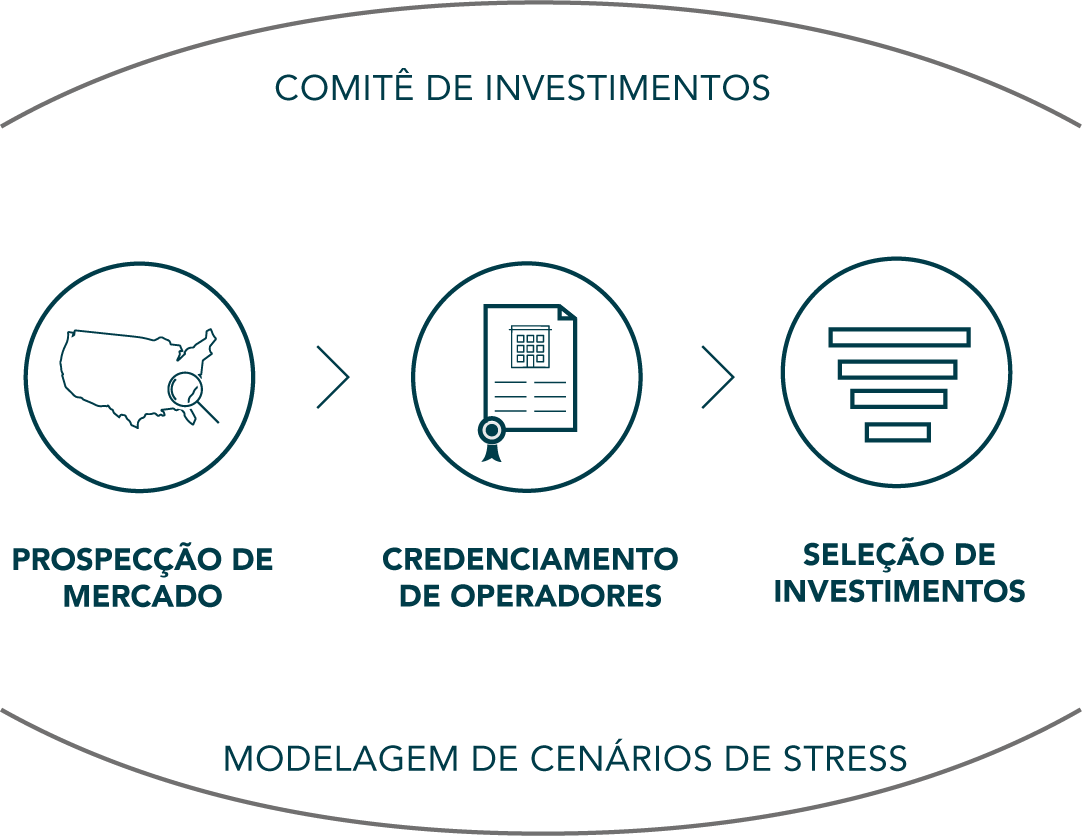
The process of selecting a real estate investment
This process begins with a general understanding of the proposed project using its initial information, such as the business plan and financial projections. With this, we identify all the relevant data of the project (property acquisition and sale value, projections of rental values and expenses, fees charged, among many others) and parameterize the information in a tool designed by Ativore.
One of the determining factors of a real estate investment's profitability is the investment's expected risk. As we have already explained in this article, the greater the risk the market assigns to the specific segment of the property in question, the greater its profitability should be. However, market risk is not the only factor that justifies the profitability of an operational real estate investment.
The Value Drivers Model
The model created by Ativore seeks to break down the Internal Rate of Return (IRR) of an investment into five factors, indicating their respective contributions to the project's return. The model's factors are:
- Market Risk: encompasses the property's characteristics, such as asset class, location and target audience.
- Acquisition Value Driver: encompasses parameters related to the purchase of the property, such as the purchase price relative to the market.
- Sale Value Driver: encompasses parameters related to the sale of the property, such as future expectations about the market and the projected sale price.
- Appreciation Value Driver: encompasses parameters related to the management strategy used by the property operator, such as the evolution of rent growth, cost reduction and occupancy rate, with a positive impact on the property's long-term cash flow and, consequently, on its market value.
- Leverage Value Driver: encompasses parameters related to the project's financing structure, such as the degree of leverage and interest rate.
Once we have the project's entire financial flow organized in our tool, we run new cash flow projections, isolating and modifying only the parameters related to a given Value Driver.
For example, if we want to calculate the Leverage Value Driver, we keep constant all the parameters related to the other Value Drivers. In this case:
- To isolate factors related to acquisition and sale in the composition of the project's total profitability (Acquisition Value Driver), we disregard any gain or loss in the transactions, assuming they will be carried out at market price.
- To isolate factors related to the projected increases in the property's cash flow from management actions (Appreciation Value Driver), we eliminate any interference from the project's strategy in the financial projections, such as property improvements and increases in the occupancy rate.
The same logic applies to the calculation of any other Value Driver. The result of the model is the graphical visualization of the decomposed IRR, as in the figure below.
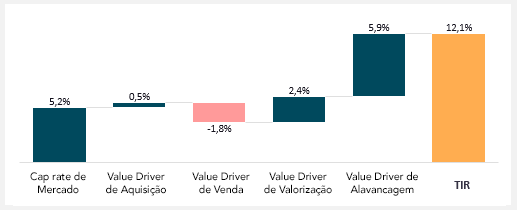
In it we can see, for example, that Leverage is the Value Driver that contributes most to achieving a 12.1% return on this investment. It is this type of conclusion that guides our subsequent discussions and analyses of each of the factors, aiming to deepen our understanding of the project's risks and the likelihood that the original projections will not be met.
It is worth noting that a negative value in a Value Driver does not necessarily represent a point that is harmful to the project, and that any result found in the model needs to be carefully evaluated. In the case above, for example, the negative value in the Sale Value Driver indicates that the project's original projections are conservative, since they consider a loss of value of the property relative to the projected market values at the time of sale, which often may not materialize.
Comparative Analysis (benchmarking)
Our methodology also includes a horizontal evaluation. Drawing on a database derived from a large number of transactions carried out by Ativore in the U.S. real estate market since 2012, including various types of properties such as residential buildings, single-family homes, self-storage, industrial properties, healthcare office buildings, among others, we compare the model's results with other similar projects (benchmarking). This is visually presented in the form of “rulers” for each of the Value Drivers.
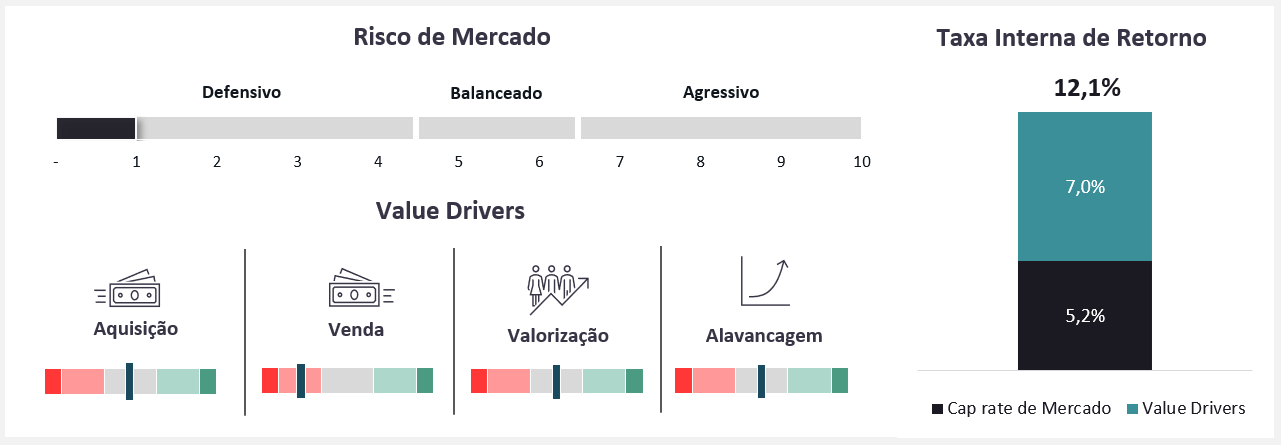
The position of the bar within the five available intervals indicates how this project compares with others, as follows:
- Gray area: represents the central measure, what is considered the “expected result” for that Value Driver.
- Light areas (red and green): indicate that the Value Driver contributes less/more to the IRR when compared to other projects.
- Dark areas (red and green): indicate that the Value Driver is much less/more representative of the IRR when compared to other projects. These cases are called “outliers” and need to be thoroughly studied and justified by our investment team.
The results of the horizontal evaluation of the Value Drivers Model also generate triggers for our investigations during investment selection, even affecting other analyses that make up the process, such as sensitivity tests and stress tests, which we will explain in detail in the upcoming articles of the series.