
Ativore's innovative approach to building diversified portfolios of private real estate funds in the U.S. combines a solid investment thesis with cutting-edge technology and many years of experience. The Investment Selection process is one of the pillars of our success in building wealth in dollars. We have already presented, in this previous article, our Investment Selection Methodology and the Value Drivers Model, and now we continue the series by describing our Sensitivity Analysis and Stress Testing Models.
These two important methods, which are complementary to each other, aim to challenge the assumptions of the investment projects presented to Ativore. After a deep understanding of the value drivers, the investment team assesses the impacts, on both risk and return, of changes in the following variables:
- exit capitalization rate (sale price);
- average occupancy;
- rent growth;
- financing interest rate (if applicable);
- capital events (if applicable).
What is sensitivity analysis?
The sensitivity analysis model allows a horizontal assessment of the elasticity of the investment's profitability. We calculate the change in the investment's result (internal rate of return) for each of the variables described above (given a 1% variation) and classify the degree of impact — high, medium or low — relative to similar projects (benchmarking).
Benchmarking is one of the great differentiators of the Ativore methodology, since, in a private market, it is only possible thanks to the company's extensive track record of participating in transactions in the U.S. real estate market since 2012 across various property types — multifamily buildings, single-family homes, self-storage, industrial properties, and healthcare office buildings.
Example of sensitivity analysis
The image below illustrates an example of the output of this stage:
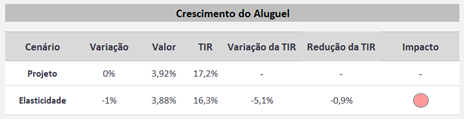
In this example, the simulation indicated that a negative change in the rent-growth value, from 3.92% to 3.88%, would reduce the IRR from 17.2% (the project's original) to 16.3%. The impact, when compared with our extensive database, was considered high and, for this reason, a red light was automatically displayed. Other possible results would be a green light, for low impact, or gray, for medium impact. The signal helps to flag the importance of obtaining even more detail about this variable.
The investment team ensures knowledge of the relevant aspects of the project through the use of checklists. Our checklists are extensive and detailed, the fruit of years of experience with projects of the most varied types. Thus, our in-depth research work covers all relevant fields, from macroeconomic aspects to the property's historical figures.
Understanding, for example, whether transaction values are in line with comparables, what the main companies and sectors of the local economy are, what the tenant profile is, or even whether the region's legislation is more favorable to landlords, can be essential for an investment decision. It is this meticulous work that allows analysts to identify the likelihood that the analyzed variable will diverge from that of the original project.
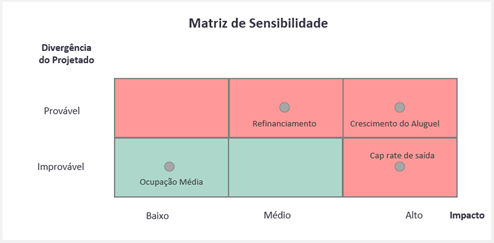
The combined results of impact and probability for each variable culminate in a sensitivity matrix, like the one in the example below, which has a direct influence on the Stress Testing Model by indicating whether the variable should be stressed or not.
How does stress testing work?
The rationale for determining which variables will be part of the Stress Test is based on the model's objective: to analyze the investment's results in the worst possible scenario. Therefore, since a variable positioned in a green area of the matrix shows no signs of diverging from the project, nor does its variation have a high impact on results, it is not stressed. A variable positioned in a red area, whether due to a high impact on the result or to signs that its real value may diverge from the original project, will necessarily be included in the stress test.
Example of stress testing
The variation imposed on a variable in the Stress Test is determined by the investment analyst from scenarios calculated by a tool based on the result of the project's Value Drivers Model. The image below facilitates this understanding.
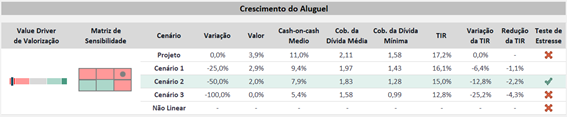
In this example, the rent-growth variable was stressed because, in the sensitivity matrix, it was positioned in the red region. The tool, according to criteria predefined by Ativore's proprietary model, then indicated the option of choosing two stress scenarios (note that scenarios that cannot be chosen are marked with an “X”) and the investment analyst selected Scenario 2.
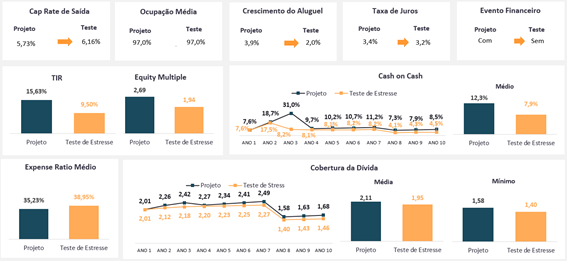
The same procedure is carried out for all variables which, together, generates a new financial projection for the investment. The main financial indicators of this new cash flow are then compared with the original; see an example below.
Finally, the Stress Test results are presented to and evaluated by the Investment Committee as a determining factor for approving or rejecting the investment, together with other qualitative aspects and the risk-return ratio.